In this Document
| Purpose |
|---|
| Troubleshooting Steps |
|---|
| What is a 'Cursor: pin S wait on X' wait? |
|---|
| What causes 'Cursor: pin S wait on X' waits? |
|---|
| How to diagnose the cause. |
|---|
| How to Examine the Diagnostics. |
|---|
| SQL ordered by Parse Calls |
|---|
| SQL ordered by Version Count |
|---|
| Potential Solutions |
|---|
| Known Issue on 12c |
|---|
| Community Discussions |
|---|
| References |
|---|
Applies to:
Oracle Database – Enterprise Edition – Version 10.2.0.1 and later Oracle Database Cloud Schema Service – Version N/A and later Oracle Database Exadata Cloud Machine – Version N/A and later Oracle Cloud Infrastructure – Database Service – Version N/A and later Oracle Database Cloud Exadata Service – Version N/A and later Information in this document applies to any platform.
Purpose
The purpose of this article is to help troubleshoot 'Cursor: pin S wait on X' waits.
Troubleshooting Steps
What is a 'Cursor: pin S wait on X' wait?
A cursor wait is associated with parsing in some form. A session may wait for this event when it is trying to get a mutex pin in Share mode but another session is holding the mutex pin on the same cursor object in exclusive. Frequently, waits for 'Cursor: pin S wait on X' is a symptom and not the cause. There may be underlying tuning requirements or known issues.
What causes 'Cursor: pin S wait on X' waits?
- Firstly, ensure that the shared pool is sized correctly.
If the shared pool is under sized or under load generally, this may manifest itself as 'Cursor: pin S wait on X'. If Automatic Memory Management is being used then this should not normally be an issue. See:Document 443746.1 Automatic Memory Management (AMM) on 11g
- Frequent Hard Parses
- High Version Counts
- Known bugs
- Parse Errors, as following note indicates:Document 1353015.1 How to Identify Hard Parse Failures
If the frequency of Hard Parsing is extremely high, then contention can occur on this pin.
When Version counts become excessive, a long chain of versions needs to be examined and this can lead to contention on this event
How to diagnose the cause.
Obtain information and diagnostics to help locate the cause.
- Run AWR and ADDM reports during the time that you see 'Cursor: pin S wait on X' waits and also collect baseline reports when you do not see the waits to make comparisons. The baseline shows us the typical 'background' concurrency and activity going on during the time of both the issue and the baseline and may help identify (for example) culprit SQLs with high version counts.
To gather this it is suggested to run AWR and ADDM for half an hour to an hour interval as follows:
SQL>@$ORACLE_HOME/rdbms/admin/awrrpt.sql SQL>@$ORACLE_HOME/rdbms/admin/addmrpt.sql
- Sometimes system state dump is necessary to match known issues. For example, if there is no obvious candidate SQL in AWR, capturing holder or waiter processes in systemstate allows you to focus in on potential problems. Run system state when processes appear hung on 'Cursor: pin S wait on X' waits:
(a) Non-Rac
sqlplus "/ as sysdba"
oradebug setmypid oradebug unlimit oradebug dump systemstate 258 wait 90 seconds oradebug dump systemstate 258 wait 90 seconds oradebug dump systemstate 258 quit
(b) RAC
$ sqlplus '/ as sysdba' oradebug setmypid oradebug unlimit oradebug setinst all oradebug -g all hanganalyze 4 oradebug -g all dump systemstate 258 quit
- Errorstacks: Another way to obtain process information is with errorstack. Assuming you can identify a blocker, taking errorstacks will provide much the same information as systemstates but with a much reduced disk footprint for trace. Once the ospid of the blocker has been found, an errorstack can be generated:
$ sqlplus SQL> oradebug setospid
oradebug dump errorstack 3 << wait 1min>> oradebug dump errorstack 3 << wait 1min>> oradebug dump errorstack 3 exit
In particular, the stack from the resultant trace can be used to match known issues.
The system state and errorstacks are not easily readable; so a Service Request may need to be opened to read the files.
- It is not always feasible to run system state dump. Thus, this note on finding the blocker can be used as well:
Document 786507.1 How to Determine the Blocking Session for Event: 'cursor: pin S wait on X'
- Furthermore, the following sqls can be ran to identify the waiters:
SELECT s.sid, t.sql_text FROM v$session s, v$sql t WHERE s.event LIKE '%cursor: pin S wait on X%' AND t.sql_id = s.sql_id
- In 11g RAC, there is another less resource intensive tool that can be used when compared with taking system state dumps:
Document 459694.1 Procwatcher: Script to Monitor and Examine Oracle DB and Clusterware Processes
How to Examine the Diagnostics.
- Look for high parsing and high version counts from AWR.
Click on *SQL Statistics under Main Report of AWR:
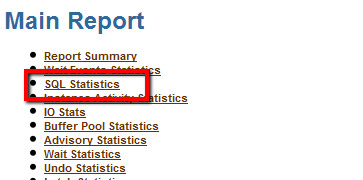
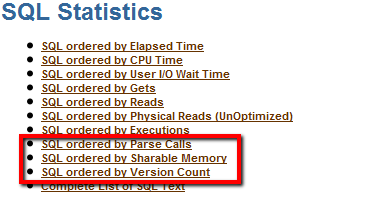
Then, under SQL Statistics click on 'SQL ordered by Parse Calls' or 'SQL ordered by Version Count' to view that information:
SQL ordered by Parse Calls
- Total Parse Calls: 2,935,390
- Captured SQL account for 95.6% of Total
Parse Calls Executions % Total Parses SQL Id SQL Module SQL Text 668,174 668,014 22.76 gpkdazvcfwkv select DATA_TABLE (… 667,440 668,234 22.74 5p9vjzht9jqb INSERT INTO DATA_TABLE (DATA_I…
From this list, investigate the top SQLs to determine whether this volume of parse calls is excessive or can be reduced.
SQL ordered by Version Count
- Only Statements with Version Count greater than 20 are displayed
Version Count Executions SQL Id SQL Module SQL Text 277 392,737 30d5a6v16mpb select FLOW_CONTEXT (… 78 131,104 7c0gj35488xs INSERT INTO PROJECT (DOC_ID, …
From this list, investigate the SQLs with the high version count. What are the reasons that these statements are not shared? Can this be addressed?
- From systemstate and errorstack, we are looking for stacks to match known issues.
For systemstates/errorstacks to be useful, it relies them being taken "at the right time". On a fast moving system, processes may have moved on so holders and waiters are not shown. In a perfect example the systemstates should show the blocker and processes being blocked or one of these. The stack from blocker may indicate known issues.
Potential Solutions
- Tune SQL(s) with high parse count by either investigating the application or the SQL.
From AWR, the parse statistics is at the top of the report under load profile:
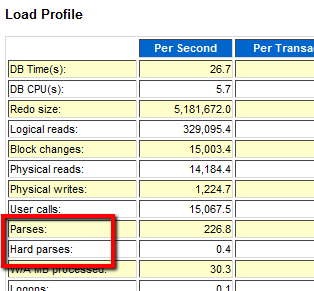
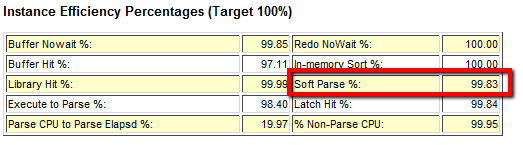
In this case there are mainly soft parses, however, if there were high hard parses, this may indicate high usage of literals or introduction of many new SQLs. In this case consider using bind variables in place of literals. If there is high percentage of soft parses, then check the application to see if it is using shareable SQLs. Ideally, Execute to Parse should be closer to 100%. The application should parse less and execute many times. See:
Document 62143.1 Understanding and Tuning the Shared Pool
Also remember if the shared pool is flushed, then sqls will need to be hard parsed. This also may cause mutex waits. So make sure sqls are in memory once hard parsed and monitor to see if mutex waits are alleviated.
- High version counts can also cause 'cursor: pin S wait on X' waits.
Check V$SQL_SHARED_CURSOR to see the potential reason for the high version count using:
Document 438755.1 Formated V$SQL_SHARED_CURSOR Report by SQLID or Hash Value Document 296377.1 Troubleshooting: High Version Count Issues
There are some notable bugs where high version counts have been a factor:
Document 10157392.8 Bug 10157392 – High version counts for SQL with binds (BIND_MISMATCH) Document 9689310.8 Bug 9689310 – Excessive child cursors / high VERSION_COUNT / OERI:17059 due to bind mismatch
- For more known defects, please go to following note and click on known bugs:
Document 1298015.1 WAITEVENT: "cursor: pin S wait on X" Reference Note
Click on the version that applies and review bug or bugs with similar scenario.
- If the database has been migrated from 10g to 11g and mutex performance issue surfaces, please consider the 11.2.0.2.2 psu + fix for unpublished Bug 12431716. Many mutex fixes are already included in patch 11204. So go to the latest patchset if possible.
Known Issue on 12c
If 'cursor: pin S wait on X' is seen after upgrade from 11g to 12c, please review following note:
Document 1949691.1 High wait time for 'cursor: pin S wait on X' After Upgrade
Troubleshooting Other Issues
For guidance troubleshooting other performance issues see:
Document 1377446.1 Troubleshooting Performance Issues
Community Discussions
Still have questions? Use the communities window below to search for similar discussions or start a new discussion on this subject. (Window is the live community not a screenshot)
Click here to open in main browser window
References
NOTE:1377446.1 – * Troubleshooting Performance Issues NOTE:62143.1 – Troubleshooting: Understanding and Tuning the Shared Pool BUG:9689310 – SPORADIC BUNCHES OF ORA-600 [17059] NOTE:10157392.8 – Bug 10157392 – High version counts for SQL with binds (BIND_MISMATCH) NOTE:1291879.1 – Oracle Database Patch Set Update 11.2.0.2.2 Known Issues NOTE:459694.1 – Procwatcher: Script to Monitor and Examine Oracle DB and Clusterware Processes NOTE:2096561.1 – High Amount Of Shared Memory Allocated Into KGLH0 Heap In 12.1.0.2 NOTE:1298015.1 – WAITEVENT: "cursor: pin S wait on X" Reference Note NOTE:2006145.1 – High Waits for 'cursor: pin S wait on X' due to Dynamic Sampling Against Parallel Queries BUG:10157392 – HIGH VERSION COUNT OF RECURSIVE SQL THOUGH THE FIX FOR BUG 10086843 WAS APPLIED NOTE:786507.1 – How to Determine the Blocking Session for Event: 'cursor: pin S wait on X' NOTE:2119923.1 – Bug 20370037 – Shared Pool from KGLH0 constantly growing causing ORA-04031 and Latch contention NOTE:9689310.8 – Bug 9689310 – Excessive child cursors / high VERSION_COUNT / ORA-600 [17059] due to bind mismatch NOTE:296377.1 – Troubleshooting: High Version Count Issues NOTE:438755.1 – High SQL Version Counts – Script to determine reason(s) NOTE:1949691.1 – High Wait Time for 'cursor: pin S wait on X' Event After Upgrade